
I recently built a fully functional, automatically updating time reporting dashboard with Claude. At BMT we have historically struggled to know how much support and development time had been spent and to tie both back to client and project budgets. One job I repeatedly had to do was total up project spend, which meant manually going through Jira tickets and timesheets and trying to reconcile hours against budgets. It took several hours, I dreaded doing it and I was normally months behind.
We started solving parts of this in 2023 when we moved support into Jira Service Management and began tracking time properly against support tickets, but we quickly discovered that Atlassian’s time-tracking reporting was surprisingly limited and needed an additional plugin, which was not particularly good either. We were capturing more data, but working out billing for clients and internal project spend continued to be a nightmare.
Trying to solve it with Make and Airtable
In 2025, when I started using Make more heavily and had also completed some client work in Airtable, I thought this workflow would finally solve the problem. I set up Jira and JSM automations which triggered webhooks, passed the data through Make and created or updated records in Airtable.
For development tickets the process was reasonably simple. When a ticket was marked as Done, the webhook triggered and the developer time was passed into Airtable. I then had to solve for developers adding time after a ticket had already been completed, so I created another automation to catch those updates.
JSM was much more complicated because I wanted to capture more of the support lifecycle and support tickets do not follow a simple A-to-B workflow. Tickets can be reopened, sent back to customers or closed automatically when nobody responds. JSM also behaves differently depending on whether a request was created through the portal or by email, and a customer replying “thanks” to a closed ticket can end up creating another request.
The webhook payloads were huge and the Make scenarios became increasingly fragile. Initially I handled the whole flow through mappings and routers, but as things started breaking I reworked parts of it and replaced some of the logic with AI modules. We were capturing more data than before, but I still could not reliably get the dataset into Airtable in the way I wanted. I planned to go back and rebuild the workflows, but in the meantime the way I was using AI had moved on.
Rethinking the problem
As I started adopting MCP servers more, I became convinced I had taken the wrong approach. I had been trying to anticipate every possible Jira state and permanently map it into another system, whereas I could now query the source data directly and use AI to help reconcile it.
I had also been experimenting with dashboards in my own products, including Weather Alert Spain. At BMT we had been implementing increasingly complex reporting in AWS QuickSight, which could take considerable time to build and change, while users across our products were continually asking for better ways to understand their data. Alongside the Nucleus and Events MCP servers we are building, I wanted to see whether we could create dashboards much more quickly.
I started by spending about an hour querying Jira and JSM with Claude and explaining what we actually needed to report. The initial question was simply how much support time we had spent during 2026, split between the support team and developers, but fairly quickly I had to start defining what those numbers actually meant.
Client came from the Organisation on the JSM ticket, while the allocation came from the resolution we use when a request is completed: Support, System Bug or Development. We decided the hours should count against the month the ticket was marked Done rather than when each individual worklog was entered, and that once a month had been closed its totals should be frozen so an invoiced month did not silently change afterwards.
Developer time was more complicated because most work on the Nucleus board is roadmap work rather than support. Where a Nucleus ticket is linked to a JSM ticket, however, we can inherit the client and product and treat that development as part of the support work. By default the dashboard therefore only counts linked Nucleus development, with the option to include all Nucleus work when somebody wants the wider picture.
Cleaning the data
Claude also started identifying gaps in the dataset. One example was an existing problem where some support tickets raised by users were not associated with the correct company account. I had spent months going backwards and forwards with Atlassian support about this without getting a proper solution, and it had also caused problems with the Make workflow.
Claude was able to identify the affected tickets and suggest the most likely client from the original ticket an email reply referred to or from the reporter’s normal organisation. I reviewed the results, corrected an edge case where one person worked across two clients and then approved the changes in batches. I did the same for missing products and resolutions, leaving the few ambiguous cases for somebody to resolve manually.
After working through the problems, I reconciled the totals against manual reports in Jira until I had a dataset I trusted enough to report against. I then asked Claude to build the dashboard.
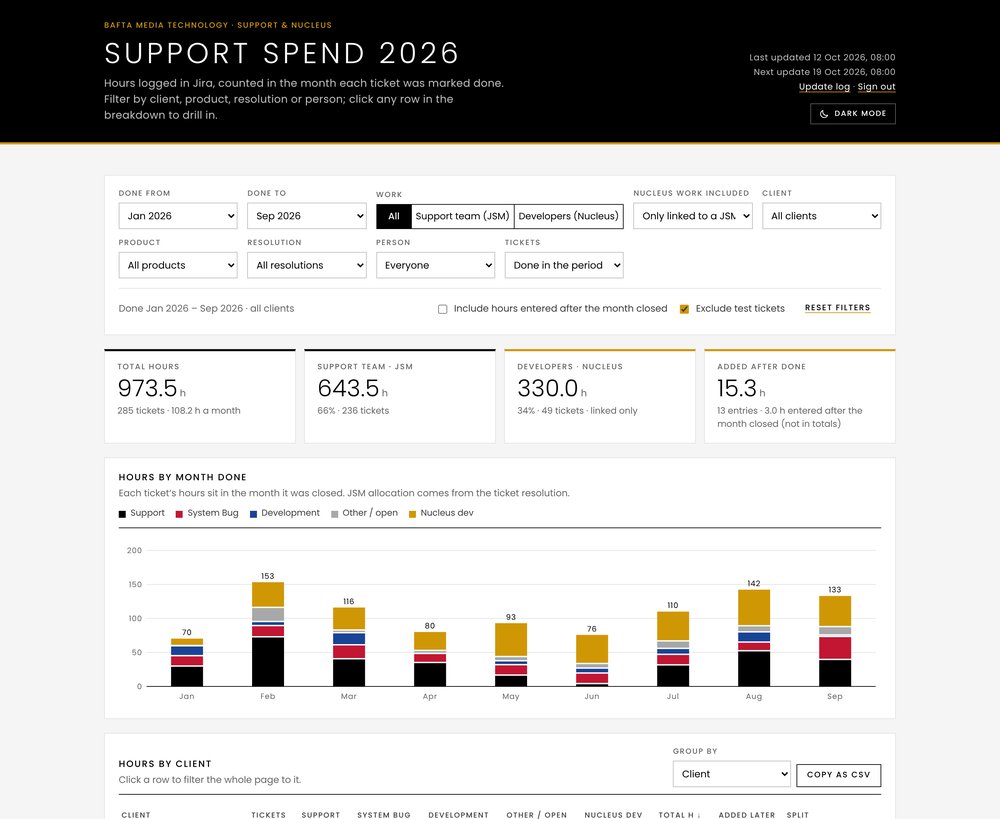
It was not a one-shot attempt, but after a few rounds of refining the queries, filters and visualisations I had something that did most of what the team needed. The dashboard could filter by month, client, product, person, work type and resolution, show support and development hours, drill down into the individual Jira tickets behind the figures and highlight time that had been added after tickets were completed.
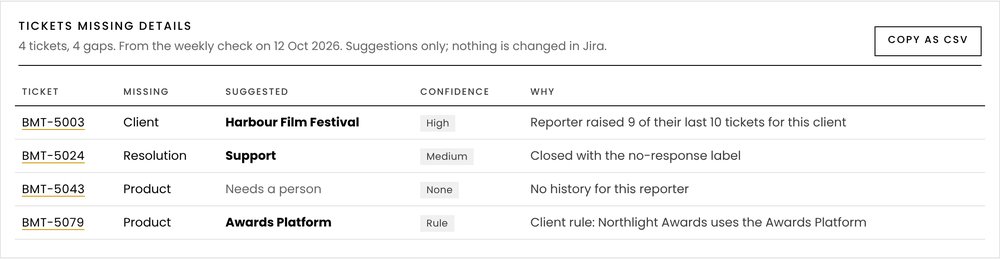
It also surfaced tickets still missing client, product or resolution data and suggested what those values might be, without writing anything back to Jira. That was important because I wanted the reporting to expose problems in the source data rather than quietly hide them.
Getting the dashboard live
The next issue was hosting it somewhere the team could actually use. I have become a big Cloudflare convert through my own projects, so I asked Claude if we could run it on a Worker with the reporting data stored in D1.
Cloudflare Access was my first choice for authentication, but enabling it required adding a credit card even on the free plan and I did not want to put my personal card onto an organisation account. For the first version I therefore protected the dashboard with a shared password, which kept the data private but was not something I wanted to keep for client billing information. I am now replacing it with a magic-link sign-in, where staff enter their BAFTA email address and receive a single-use link that expires after 15 minutes, but only once I have approved their access.
Claude wrote the TypeScript application in its own workspace, pushed it into a private GitHub repository and used the Cloudflare connection to create the database and check the deployment. GitHub Actions handle the tests, database changes and deployments, while the Jira credentials and other keys are stored as secrets rather than in the application code.
I also did not want it to look like a generic AI-generated admin screen, so I had it restyled around the BAFTA brand guidelines with light and dark modes. All of this, from the initial reporting question through to the live dashboard, took around four hours.
Making it update itself
A dashboard that I needed to manually rebuild every month would have replaced one manual process with another, so the final step was automating the updates. The dashboard is set up to run a weekly check to pick up new work, open tickets and time entered against previously completed work, while another scheduled job closes and freezes the previous month. I have tested that the jobs work, although they have not yet run on their real schedule.
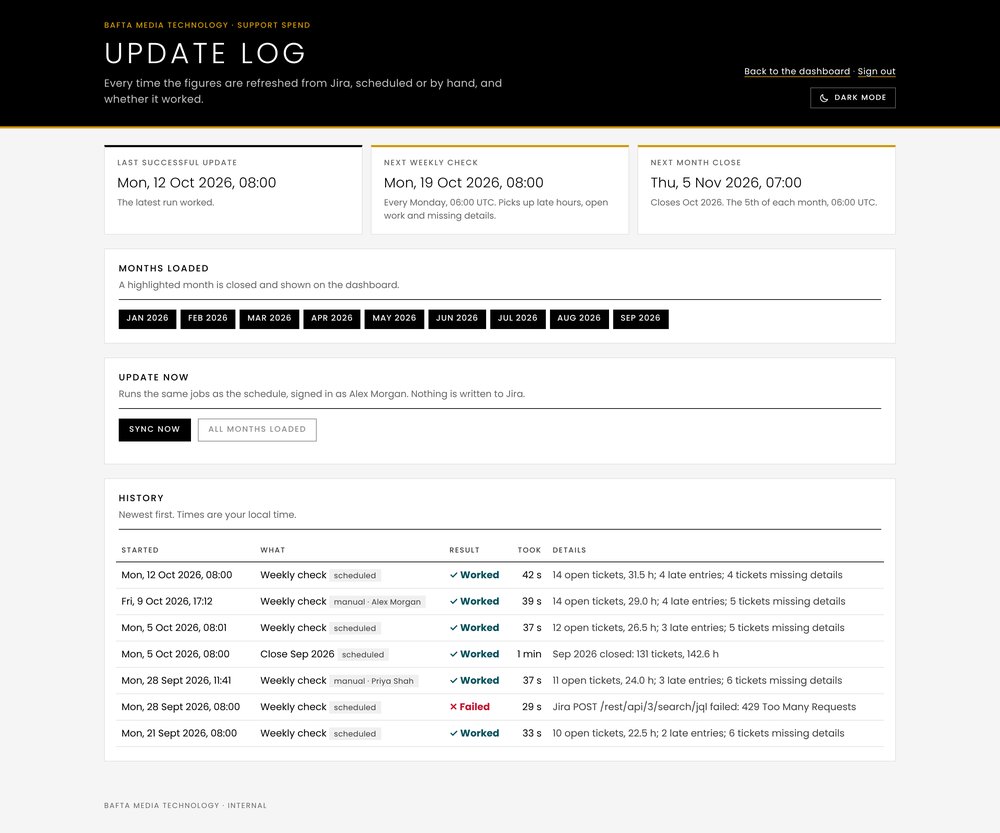
There is also an update page showing when jobs ran, whether they succeeded and when the next update is due, alongside controls for manually refreshing the data when required. I backfilled January to September so the team had useful historical reporting immediately rather than waiting for the data to build up.
I shared the dashboard with the team as an example of the kind of reporting we could start creating for BAFTA and our clients. The first responses focused on how much time it would save compared with opening each ticket manually, and it has already been raised in team meetings. The billing team could see the development and support time without waiting for me to manually reconcile it, the support team could understand where their time was going and the Director had direct access to figures which previously either did not exist or took hours to put together.
Because the data is still spread across JSM and Jira and messy in places, I also asked colleagues to test it against their own figures and requested a security review before relying on it more widely.
More importantly for me, it proved the wider idea. I had been wondering whether AI could get us to useful dashboards much faster than the reporting approaches we had been using, and this was the first time I had taken that from messy live operational data all the way through to an automated dashboard being used by other people.
Applying this to Nucleus and Events reporting
I still need a few sessions to finish the new sign-in, finesse the BMT dashboard, check more edge cases, see the scheduled updates run in practice and tidy some of the documentation. I also want to add project budgets and find a way to pull in timesheets, which is the part of the original problem it does not yet solve, and the figures will only be as complete as the time people log against tickets. The bigger opportunity, though, is what happens when the Nucleus and Events MCP servers are available.
Our clients regularly want reporting specific to the way they run their awards or events. Historically that can mean defining the requirement, creating queries, building the reporting layer and then implementing and refining the visualisation. Something which sounds like a straightforward dashboard can quickly become days or weeks of work.
With the MCP servers in place, I should be able to query the product data, define the reporting rules with the client, prototype a dashboard quickly and then have the implementation reviewed before it is surfaced securely through the product. Clients and staff will still need to commission the work and decide what they actually want to measure, but it should get us much closer to building useful reporting in hours rather than days or weeks.
I do not think I would give administrators an unrestricted AI dashboard builder yet. There is still a level of complexity around permissions, interpreting the data correctly and verifying the queries and code the AI produces. For now I see this as a way for us to build custom reporting much faster while keeping a Product Manager and developer involved in deciding what should be built and checking that the result is correct.
You may also like
Working on a product or workflow that needs to work better?
Whether the problem is an existing platform, a manual process, disconnected systems or an idea for automation or AI, I can help work out the right approach and take it into delivery.